
Intelligence is Highly Genetic

Are intellectual differences genetic? This page presents the main scientific arguments supporting a genetic basis for variations in intelligence.
1. High Heritability
We know this because identical twins in the USA, Europe, Japan, or India tend to have the same intelligence, even if each twin is raised in a different household. The correlation (on a scale of 0 to 1) of adult intelligence between identical twins raised apart is about 0.85.
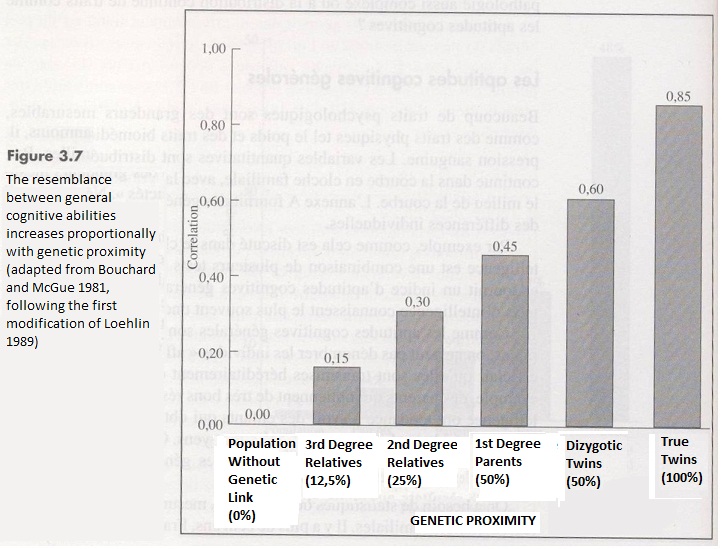
Table extracted from “Behavior Genetics”, Plomin, Fries, McClearn, Rutter, 1997.
-> points out the genetic causality of intelligence (polygenic trait)
The intellectual correlation between children adopted together, but without any genetic links, makes it possible to estimate the importance of the environment. The correlation is 0 in adulthood: as surprising as it may seem, the living environment/education has no impact on general intelligence in adulthood.
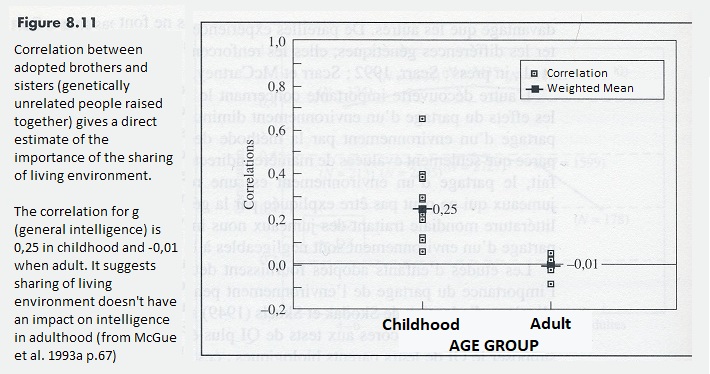
Table extracted from “Behavioral Genetics”, Plomin, Fries, McClearn, Rutter, 1997.
What is the heritability of intelligence?
-> Heritability of intelligence = part of the variance attributable to genetic factors. There are several ways to estimate it… pointing to a heritability of about >0.8 in adulthood.
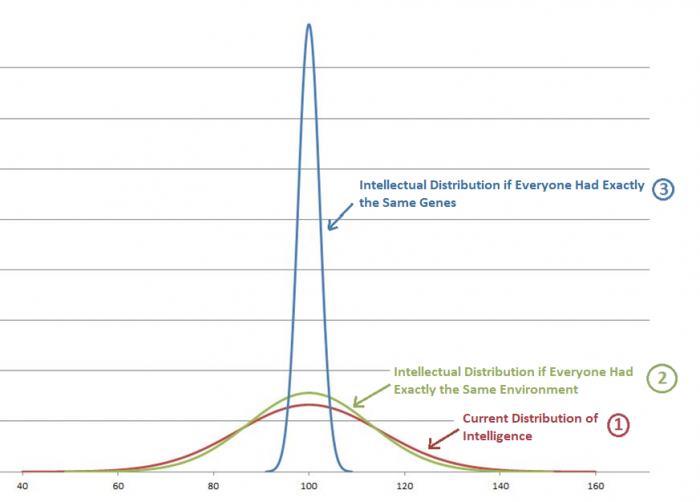
Illustration of the genetic and “environmental” part of intelligence.
If everyone were raised in the same environment, intellectual differences between individuals would be reduced to 80% of the current differences. There are 3 ways to estimate it … pointing to a heritability of over 0.8 in adulthood.
1. Studies of true twins reared in different environments (Data summarized by Bouchard, 1993, p.58). In adults, the data are based on 5 studies summarized by Bouchard. The weighted average correlation for the sample size is 0.75. This figure must be corrected for test reliability (attenuation correction) (Bouchard, 1993, p.49; Machintosh, 1998). This correction increases the correlation to 0.83.
2. A second method for estimating heritability is to compare the degree of similarity between identical twins and non-identical twins of the same sex, raised in the same family. The correlation is 0.88 for identical twins and 0.51 for non-identical twins of the same sex. After correcting these figures for test reliability (mitigation correction), the corrected correlation becomes 0.98 for identical twins and 0.56 for non-identical twins.
Heritability can be calculated using Falconer’s (1960) formula by doubling the difference between the correlations of identical and non-identical twins of the same sex. The difference between the two correlations is 0.42; doubling this difference gives a heritability of 0.84.
3. A third method for estimating heritability is to examine the IQ correlation between children of different biological parents adopted and raised in the same families. This makes it possible to estimate the magnitude of the effect of the family environment (“between-family effect”). Bouchard (1998) summarized the literature on the subject and concluded that in adults, the correlation is 0.04, indicating a heritability of 0.96.
-> The first two methods are more precise and give an estimate of 0.84 and 0.85 for the heritability of intelligence.The conclusion that intelligence has a high heritability implies that there are genes that influence intelligence. The first was discovered by Chorley et al. (1998). It is located on chromosome 6, and possessing one of the alleles of this gene can contribute up to 4 IQ points. Since then, thousands of alleles associated with intelligence have been identified through GWAS.
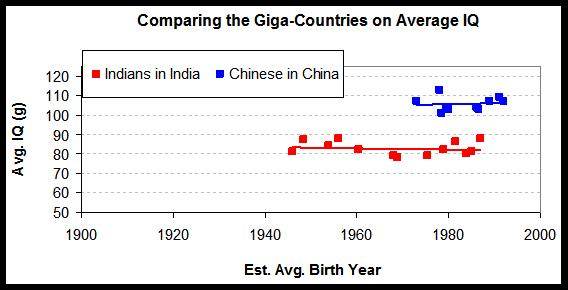
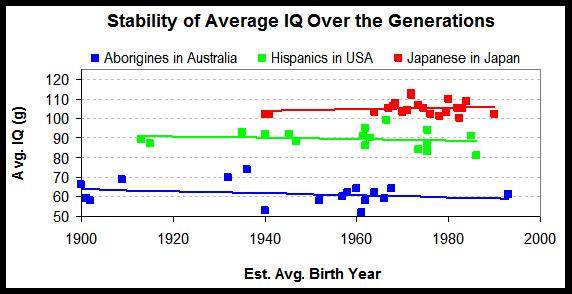
2. High Stability of Racial IQ in Different Environments4
-> supports genetic causality (Arabs in Europe of first and second generation, immigration …)
Slight increase (84 to 88 for Arabs … genes “hold improvement on leach4.2“)
1. Ashkenazi Jews (110) (America, Europe …)
2. East Asians (105) (Asia, Europe, America …)
3. Europeans (100) (Australia, America, Europe …)
4. Inuit (91)
5. Caucasian-African Hybrids (90) (Europe, America …)
6. Southeast Asians (90) (Europe, America, Asia)
7. Native Americans (87) (North and South America)
8. North African and South Asian (86) (Middle East, America, Europe …)
9. Africans (80) (Europe, North and South America, Africa)
10. Australian Aborigines (62)
This hierarchy remains rigorously unchanged and is reflected in all multiracial countries4.1 In almost all social parameters (wages, socio-economic levels, level of crimes and offenses, prevalence of talented people, prevalence of mental retardation … see “Worldwide Hierarchy“)
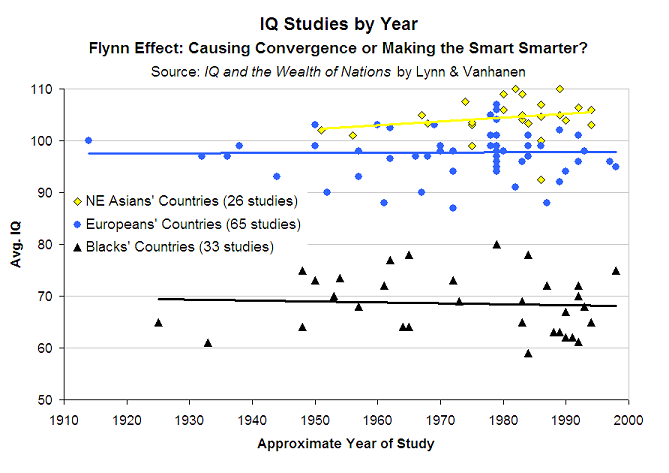
3. Stability Over Time 4.2
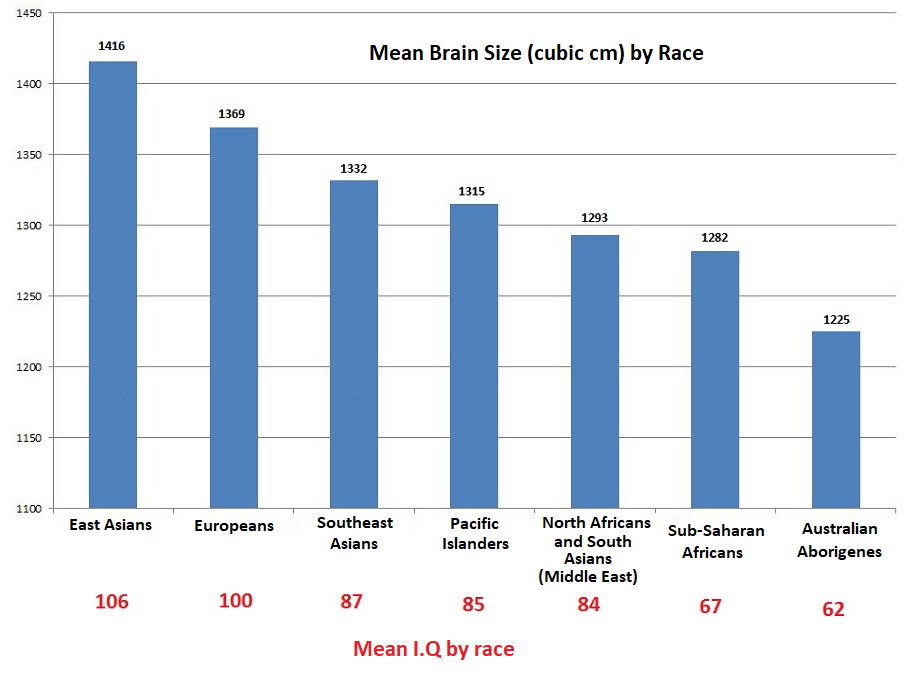
4. IQ Differences are Reflected in Brain Size Differences5
Table 9.8. Race differences in brain site (cc) and intelligence
| Race | IQ | Brain Size (cc) |
|---|---|---|
| East Asians | 105 | 1416 |
| Europeans | 100 | 1369 |
| Southeast Asians | 90 | 1332 |
| Pacific Islanders | 85 | 1317 |
| South Asians and North Africans | 84 | 1293 |
| Africans | 67 | 1282 |
| Australian aborigines | 62 | 1225 |
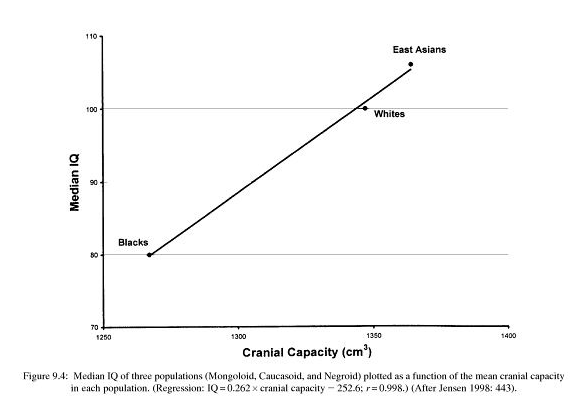
Brain size and I.Q. for Africans, Europeans, and East-Asians6.
5. Isolation Time
When two populations evolve in isolation during such a period, differences occur in all areas where genetic variation is possible. The extreme environmentalist position, postulating that there are no intellectual differences between the two races, defies the general principle of biological evolution and can be seen as impossible.
6. Studies on Racial Hybrids
6.1 African-European Hybrids7
| # | Location | Age | Test | Europeans | Hybrids | Africans | Reference | |||
|---|---|---|---|---|---|---|---|---|---|---|
| N | IQ | N | IQ | N | IQ | |||||
| 1 | Brazil | 10 | SPM | 735 | 95 | 718 | 81 | 223 | 71 | Fernandez, 2001 |
| 2 | Germany | 5-13 | WISC | 1,099 | 100 | 170 | 94 | – | – | Eyferth, 1961 |
| 3 | South Africa | 10-12 | AAB | 10,000 | 100 | 6,196 | 83 | 293 | 65 | Fick, 1929 |
| 4 | South Africa | 13 | GSAT | 746 | 100 | 815 | 86 | – | – | Claassen, 1990 |
| 5 | South Africa | 15 | SPM | 1,056 | 100 | 778 | 80 | 1,093 | 74 | Owen, 1992 |
| 6 | USA | 17 | WISC-R | 16 | 102 | 55 | 94 | 17 | 85 | Weinberg et al., 1992 |
| 7 | USA | Adult | Otis | – | 100 | 284 | 91 | 176 | 87 | Codwell, 1947 |
| 8 | USA | Adult | Vocab | 1,245 | 100 | 304 | 92 | 146 | 85 | Lynn, 2002 |
| 9 | USA | Adult | Vocab | 10,315 | 100 | 116 | 97 | 4,271 | 89 | Rowe, 2002 |
| 10 | Canada | 7-12 | PP | 100 | – | 46 | 93 | 46 | 78 | Tanser, 1941 |
6.2 Native American-European Hybrids8
Table 12.4. IQs of Native American-European Hybrids
| # | Location | Age | Test | N Europeans |
IQ Europeans |
N Hybrids |
IQ Hybrids |
N Amerinds |
IQ Amerinds |
Reference |
|---|---|---|---|---|---|---|---|---|---|---|
| 1 | Kansas | Adult | OTIS | – | 100 | 536 | 93 | 179 | 67 | Hunter & Sommermeir, 1922 |
| 2 | South Dakota | 10-15 | OTIS | – | 100 | 68 | 89 | 15 | 86 | Fitzgerald & Ludeman, 1925 |
| 3 | Mexico | 7-10 | SPM | 155 | 98 | 571 | 94 | 194 | 83 | Lynn et al., 2005 |
| 4 | Bolivia | 6-16 | WISC4 | – | – | 62 | 94 | – | – | Virues-Ortega et al., 2011 |
6.3 Pacific Islander-European Hybrids9
I.Q. of Hawallan-European hybrids and Hawallan-Chinese hybrids.
Table 9.3. IQs of Europeans, Chinese, and Pacific Islander Hybrids
| Group | N | IQ |
|---|---|---|
| European | 1,000 | 100 |
| Chinese | 2,704 | 99 |
| European-Hawaiian | 842 | 93 |
| Chinese-Hawaiian | 751 | 91 |
| Hawaiian | 621 | 81 |
6.4 East Asian-European Hybrids10
Table 10.5. IQs and brain size (cc) of East Asian-European hybrids
| East Asian | Hybrid | European | African | |
|---|---|---|---|---|
| Number | 63 | 37 | 17,432 | 19,419 |
| IQ – Raw | 114 | 103 | 102 | 90 |
| IQ – Adjusted | 109 | 98 | 97 | 85 |
| Brain size | 1,170 | 1,155 | 1,150 | 1,134 |
6.5 Australian Aborigines-European Hybrids11.
| Age | N | Test | g | Reas | Verb | Vis | Reference |
|---|---|---|---|---|---|---|---|
| 10 | 28 | PM | 95 | – | – | 95 | Porteus, 1917 |
| 5 | 19 | PPVT | 79 | – | 79 | – | Teasdale & Katz, 1968 |
| 5 | 19 | ITPA | 77 | – | 77 | – | Teasdale & Katz, 1968 |
| 6–12 | 13 | PPVT | 69 | – | – | – | De Lacey, 1976, 1971a, 1971b |
7. Qualitative Differences in the Brain
Africans and Europeans12:
-The cortex of Africans is, on average, 15% thinner than that of Europeans.
-Africans have a smaller frontal and occipital lobe and a wider parietal lobe.
-Africans have a lower proportion of pyramidal neurons than Europeans.
Australian Aborigines and Europeans13:
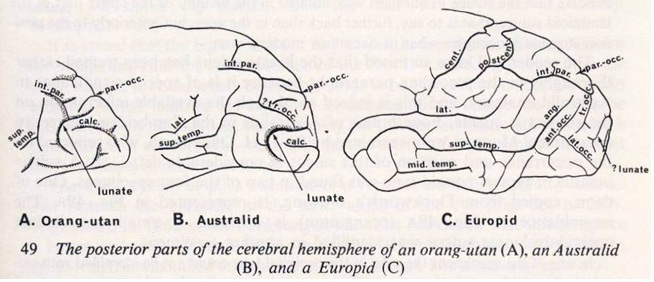
From « Race », John R. Baker, Oxford Biology Professor13.
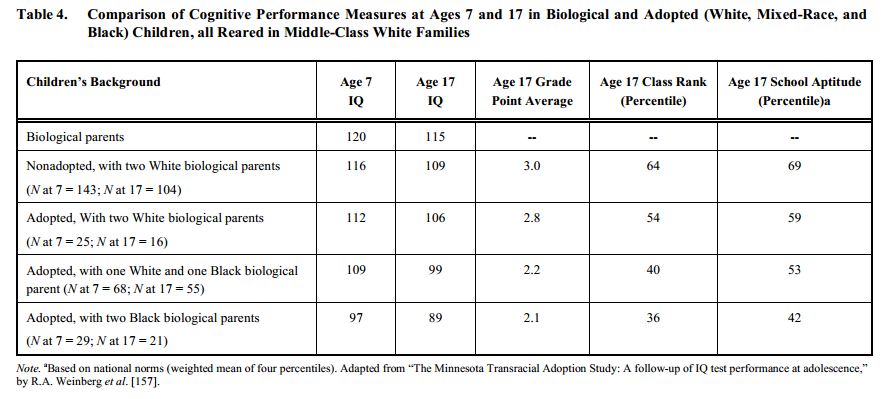
8. Adoption Studies
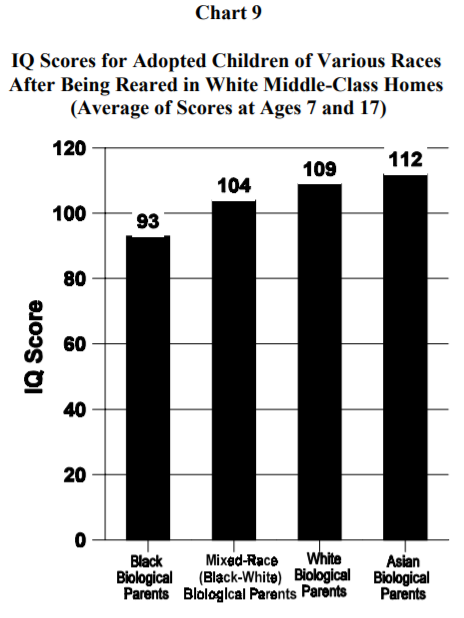
Koreans adopted by Belgians: 106 with average I.Q.
For children who are all adopted by European parents, there is a difference of 16 I.Q. between African and European, the same as this found in the whole of America.Raising black children in a middle-class white family does not affect their I.Q. at 17 years old.
Education has no more effect on East Asians adopted by Caucasians, their average IQ remaining higher.
-> Genetic factors.
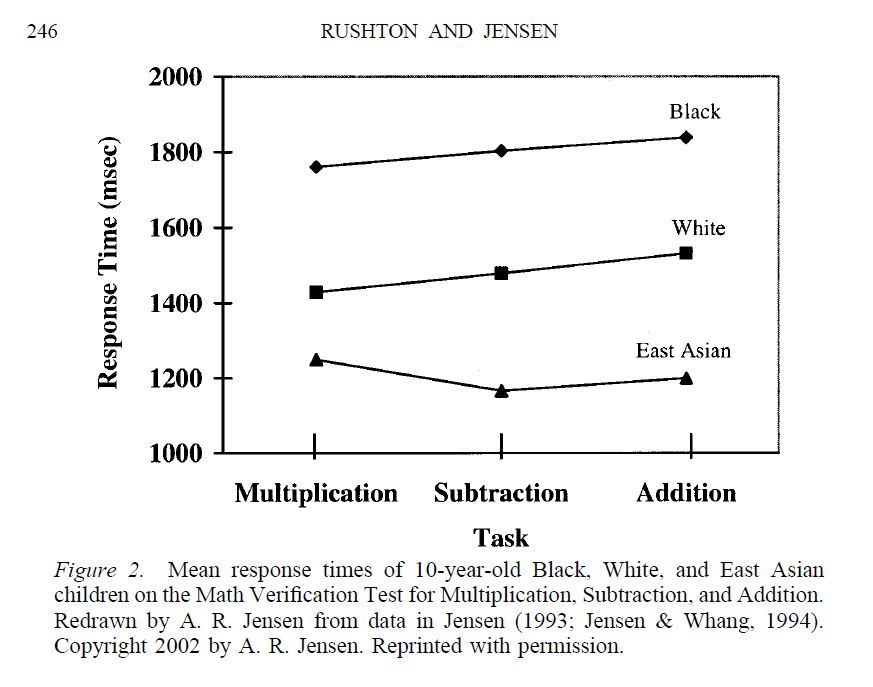
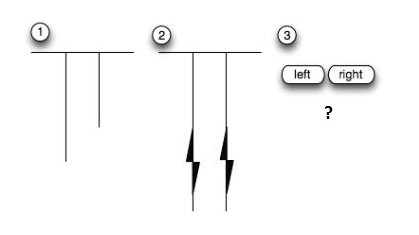
9. “reaction time”
Reaction time is correlated with I.Q., as both are signs of central nervous system efficiency. On average, Caucasians react faster to a stimulus than Africans.The tested individual is placed in front of a small lamp that will light up. Whenever this happens, he simply presses the button in front of him as quickly as possible.
This is a sign of the nervous system’s efficiency, as it involves a basic process of information traveling back to the brain and then back down to press the button. Reaction times are measured in milliseconds.
Reaction Times and EEGs among Africans, Europeans, and East Asians4.3.
| Test | Africans | Europeans | East Asians | |
|---|---|---|---|---|
| IQ | 68 | 100 | 106 | |
| 2 | RT-S | 398 | 371 | 348 |
| 3 | RT-C | 1,950 | 1,220 | – |
| 4 | EEG | 534 | 506 | – |
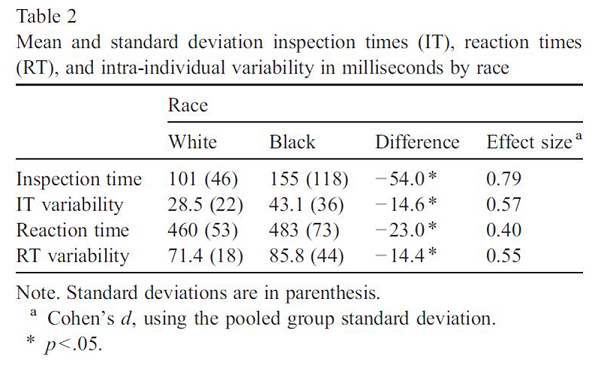
10. “Inspection time”
Inspection time measures the speed at which we process visual or auditory information. Inspection time measures are correlated at +0.7 with I.Q.
High-IQ people process visual or auditory information more quickly. They have smaller inspection times.There are significant racial differences in inspection time.
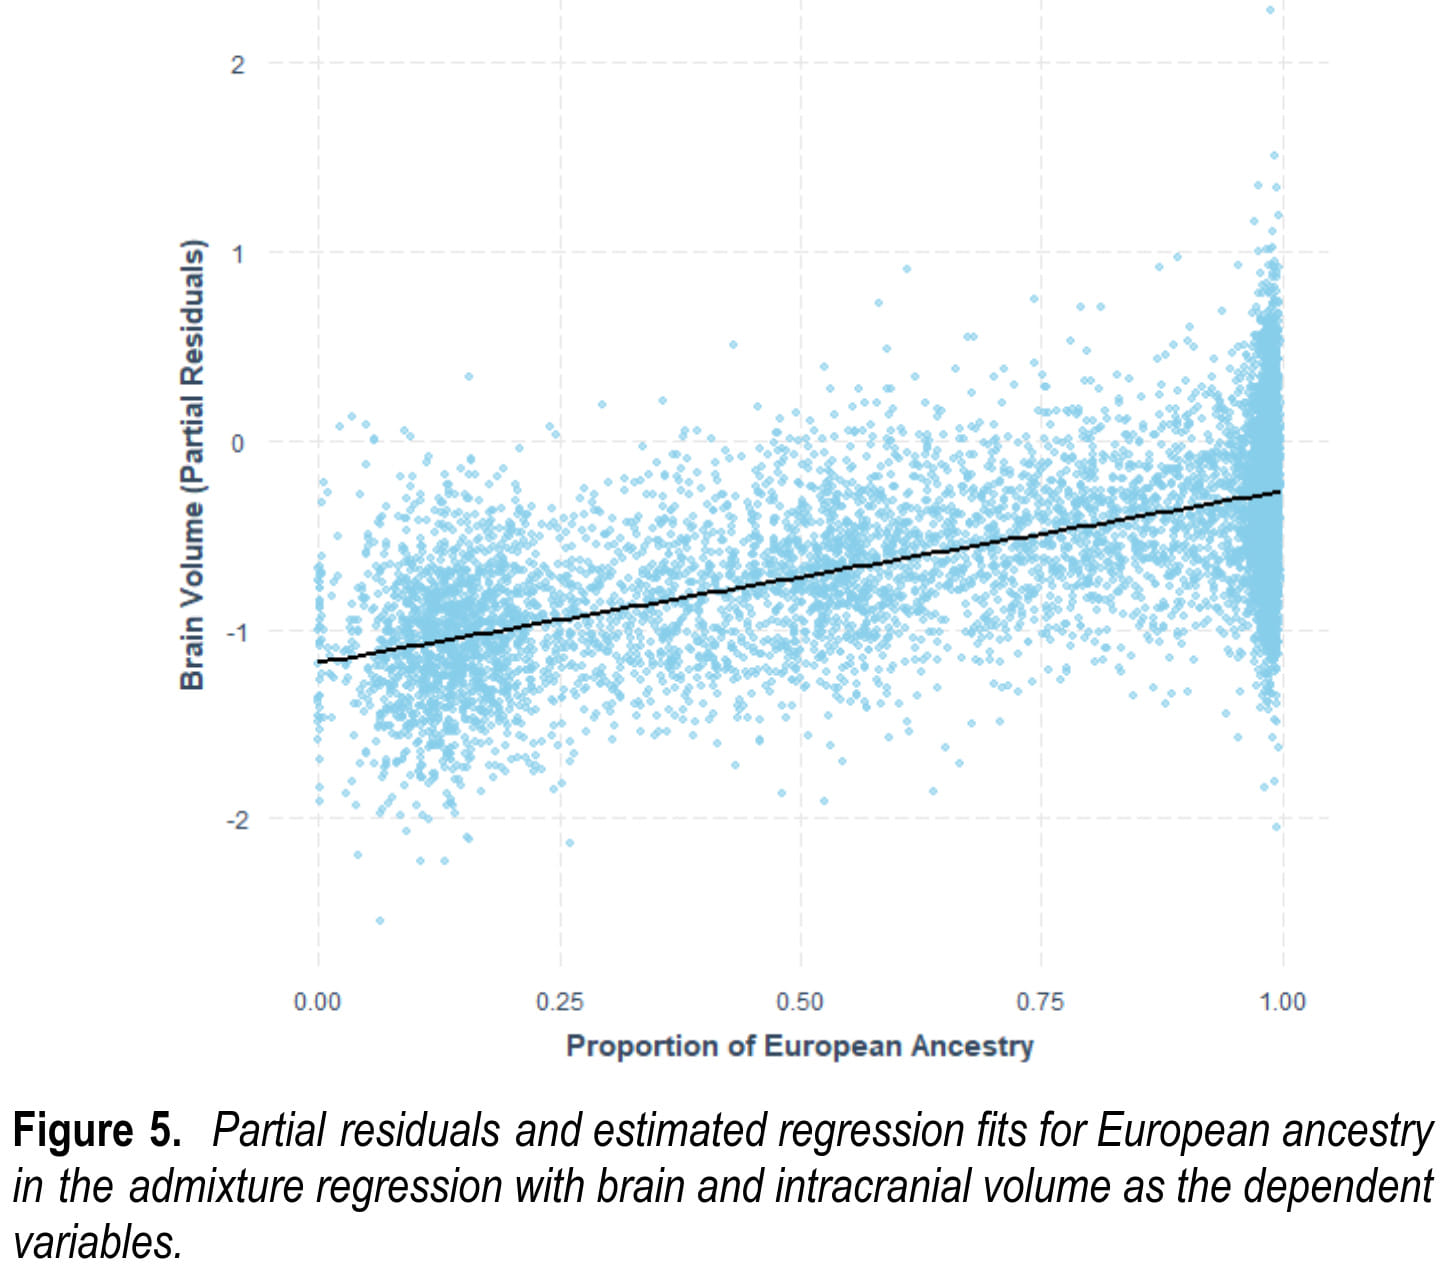
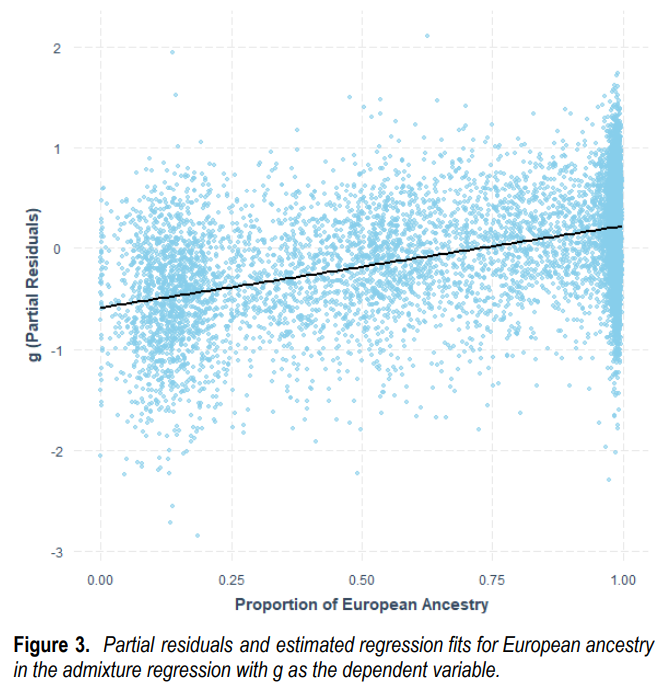
11. European Ancestry among Afro-Americans
• 25% of European descent: 85 (African-Americans)
• Mean I.Q. for African Americans with 50% European descent: 90
• Mean I.Q. for African Americans with 75% of European ancestry: 95
(a) Brain Volume as a function of White admixture (from 0 to 100%)
(b) IQ (g) as a function of White admixture (from 0 to 100%)
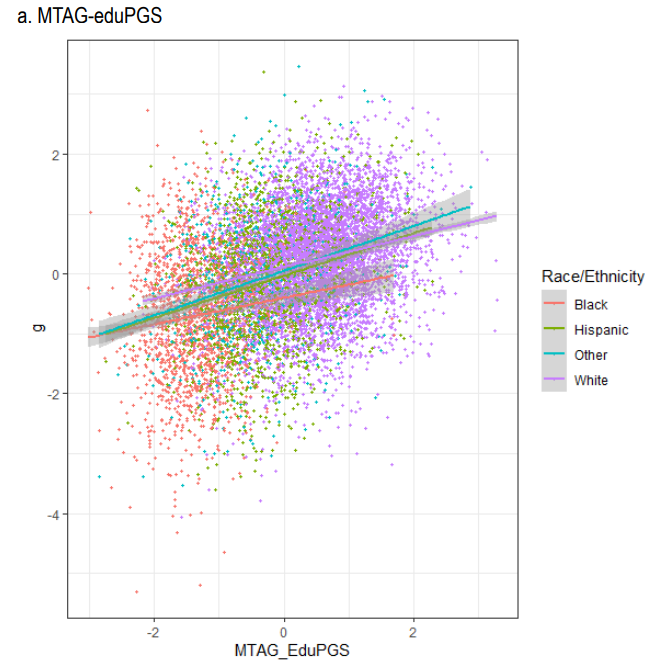
(c) Polygenic scores for Blacks (red) and Whites (purple) and corresponding g (IQ)
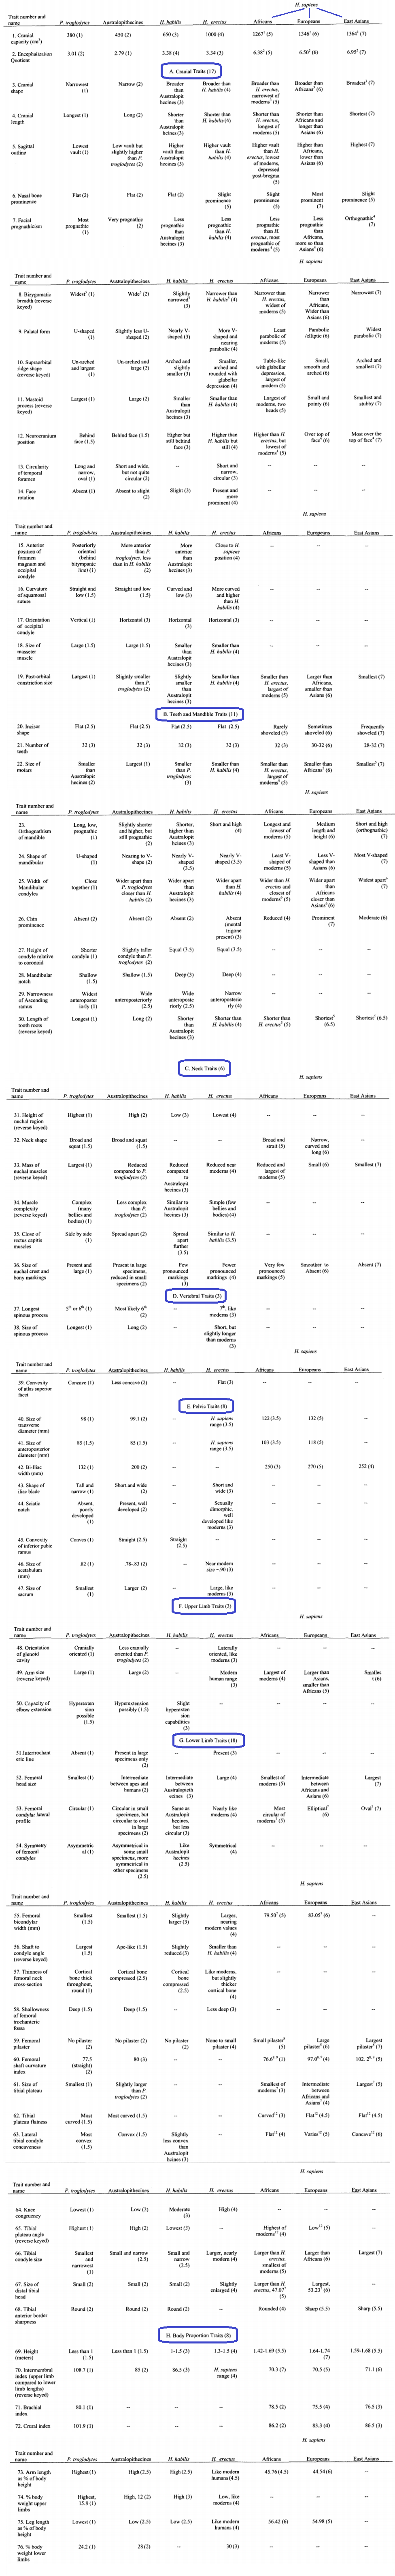
12. 76 musculoskeletal features, proximity to homo erectus15
Racial differences in brain size are correlated with 76 musculoskeletal traits identified in standard works of evolutionary anatomy as being systematically related to an increase in cranial capacity and intelligence in hominids.
• Among these differences, we find:
– The transverse diameter of the pelvis: The increase in brain size and intelligence is associated with an increase in the pelvic transversal diameter to allow the passage of the skull at birth. Africans have a significantly smaller pelvic diameter than Europeans (27.4 cm against 24.6 cm for Africans). Asians have a larger diameter than Europeans.
As a consequence of a larger pelvis, the femur, which inserted itself at the level of the pelvis, curved since it was overflown from a growing pelvis, especially the femoral insertions and causing an angle greater for the release of the two objects, the character needed to be involved in a proper junction with the peron, causing a risk incurvation. Europeans have a significantly higher femoral angle than Africans and significantly less than East Asians.
-While intelligence and brain size have increased, brains are now more spherical and deep. Europeans have significantly more spherical brains, deeper and bigger than Africans.
The increase in sphericity has therefore reduced the protuberances, in particular the mastoid process. Whites have a significantly smaller mastoid process than blacks.
The increase in generic capacity occurred towards the front of the skull. It appeared as a decrease in prognathism and an increase in orthognathism (flatter face). Europeans have significantly less prognathic and more orthognathic faces than Africans.
Consult the full study “Progressive Change in Brain Size and Muskulo-Skeletal Traits in 7 Hominoid Populations” Human Evolution (2004) Vol. 19
In detail …
13. Intelligence is Part of a Set of Evolutionary traits
East Asians and Africans are at the two ends of a continuum, with Europeans in an intermediate position, not only in terms of mean scores on cognitive tests and brain size, but also on 60 variables, including ripening speed, personality, reproduction, and social organization. It seems unlikely that social factors can produce this coherent model across such a diverse set of behaviors. This shows that intelligence is part of a larger evolutionary process.
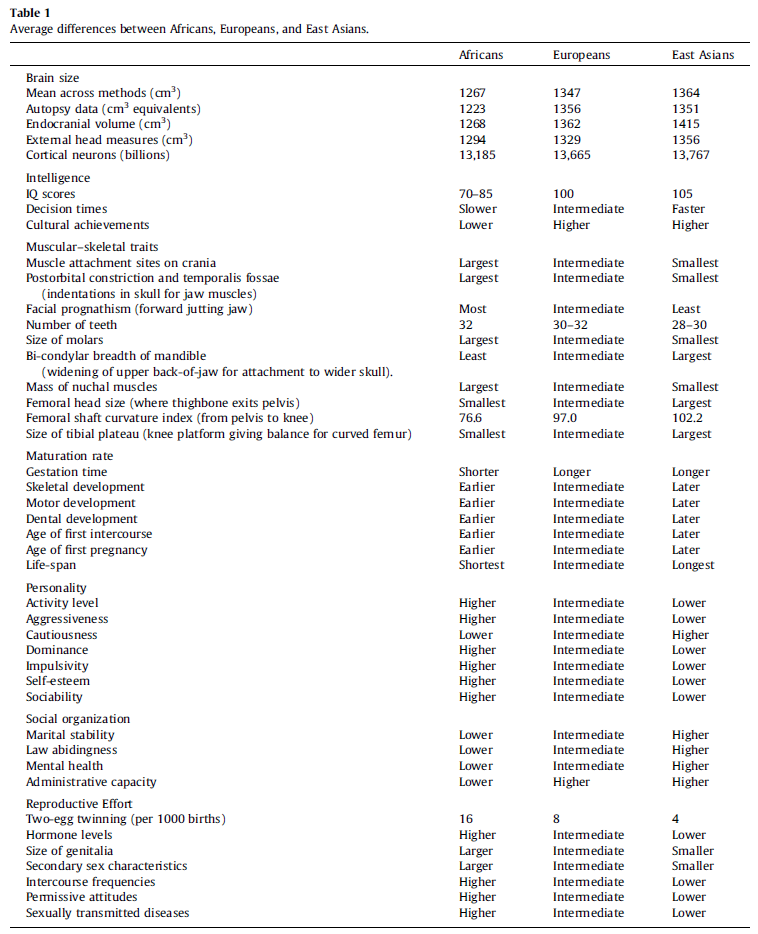
From “Rushton’s contributions to the study of mental ability” Arthur R. Jensen, Personality and Individual Differences, 2012.
In fact, Africans are more r-selected than Europeans, who are more r-selected than East Asians, following the zoological r/K selection gradient. For more details, see Rushton’s comparative perspective.
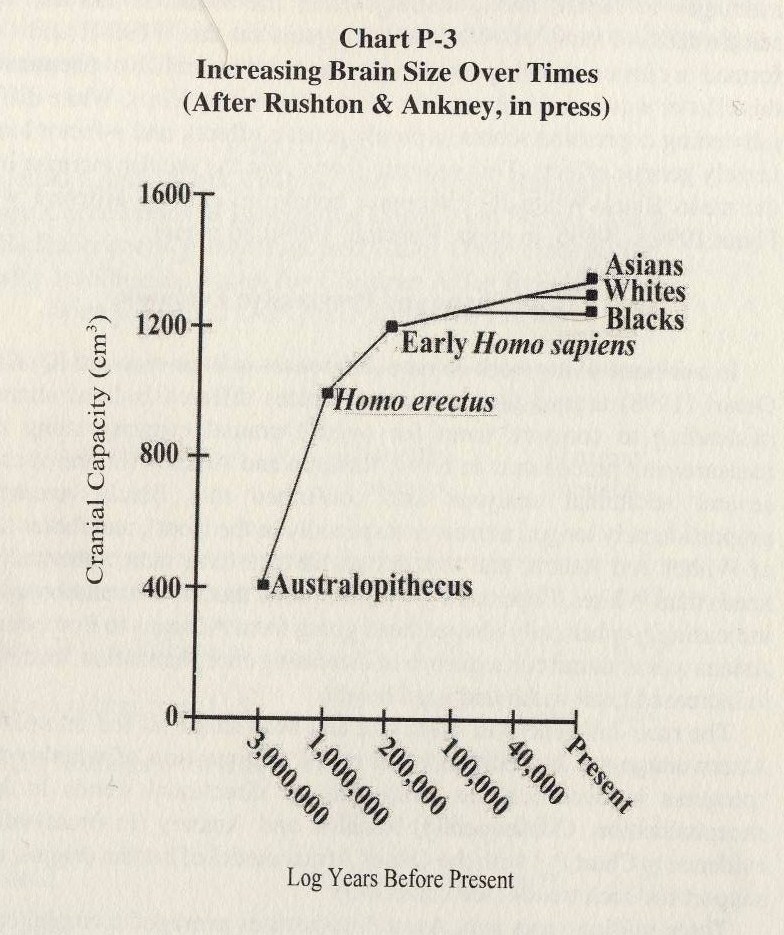
14. Position in Evolution
15. Regression to the Mean
Regression to the Mean for Stature
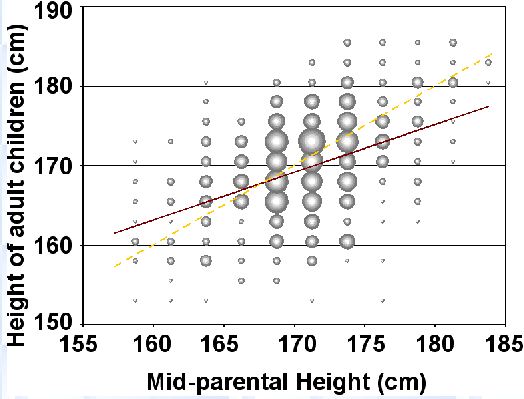
Regression to the Mean for Intelligence
How to understand the phenomenon of regression to the mean?
Imagine two beans of the same size: beans A and beans B.
Bean A comes from a breed (= variety) of large beans. The bean B comes from a breed of small beans.
The seeds of beans A and beans B are planted. What is observed in the offspring?
The progeny of bean A will show a “regression” to its higher average size: the beans will be bigger.
The progeny of bean B will regress towards the racial average of B, namely a smaller size.
This phenomenon is observed in terms of IQ and intelligence: consider two couples with an average IQ of 110, an African couple and a European couple.
The children of the European couple will regress towards the European intellectual average of 100: they will have an average IQ The children of the African couple will regress towards the African IQ mean of 80; they will have an average IQ of 95.
This phenomenon of regression to the mean is also noticeable among low IQs: a child of a European couple with an average IQ of 75 will have an IQ of 87.5 (regression towards the average of 100), whereas a child of an African couple with a mean IQ of 75 will average 77.5 IQ (regression to the mean of 80).
-> Signature of the European genotypic average at 100 and the African genotypic average at 80.
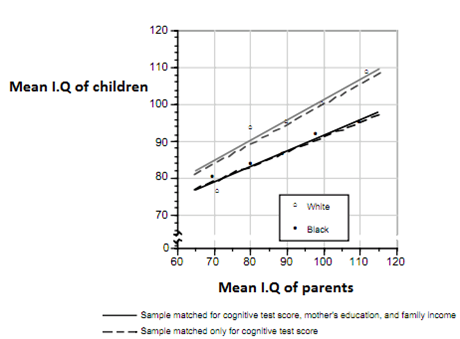
Regression to the mean for intelligence
-> Signature of genetic causality of intelligence
-> Additive genetic model
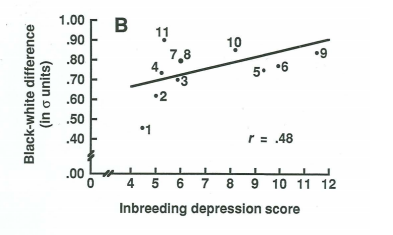
16. Inbreeding Depression
• Decreased “fitness” in the offspring of the crossing of individuals (or animals … man is an animal) genetically too close
• 7-IQ point deficit in the offspring of first-generation cousin crosses
-> Point to the genetic causality of intelligence.
17. Racial Differences in EEG16
As explained (see here), the evoked potentials of smarter individuals have a smaller score: the frequency of alpha waves is higher.
In other words, the transmission of information is faster in bright people.
There is a significant difference in EEG scores between races.
Table 4.10. EEGs of Africans and Europeans
| Test | Africans in Africa | Europeans in Europe | |
|---|---|---|---|
| 1 | IQ | 68 | 105 |
| 2 | EEG | 534 | 506 |
18. Spearman’s Hypothesis
The magnitude of the intellectual difference between two races, observed in cognitive skill tests, is proportional to its saturation in g.
An example of the difference between European and African Americans. The difference is 1 SD = 15 IQ points
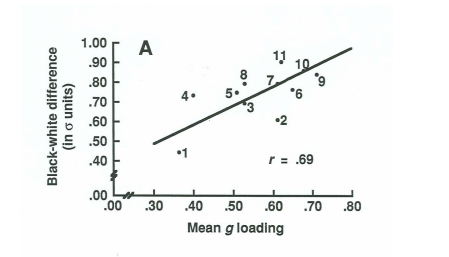
In other words, the more a test is saturated in g (the more it will imply a cognitive complexity), the more the difference will be marked.
-> A difference in g is mainly responsible for the racial intellectual differences observed.
Spearman’s Hypothesis (Wikipedia).
19. The Heritability of Intelligence Increases with Age
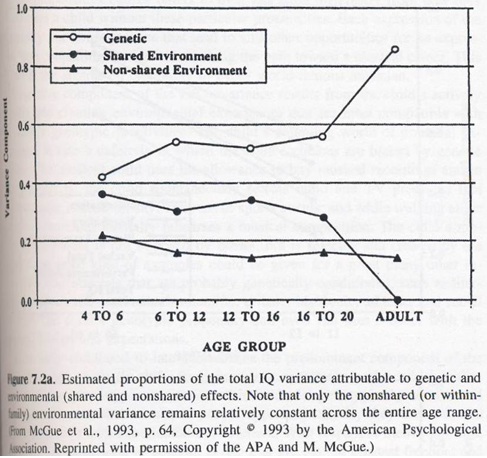
-> This points to the genetic causality of intelligence.
If the environment had an impact, its importance should increase with age, but the opposite is happening.
The non-shared environment essentially targets the in utero environment.
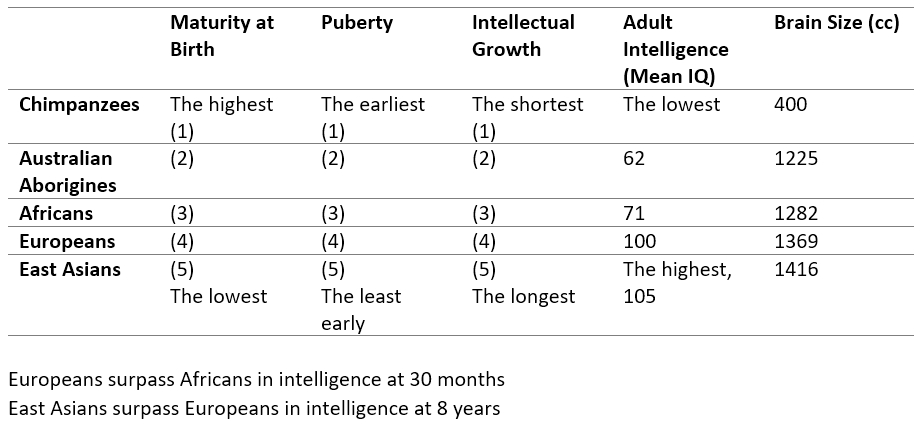
20. Racial Differences in Intellectual Maturation Speeds
→ (1) Fastest intellectual development among Australian Aborigines and lowest final intelligence (mean IQ 62)
→ (2) Intellectual development among Africans a little slower than among Aborigines, and final intelligence a little higher (mean IQ 71)
→ (3) Intellectual development among Europeans slower than Africans and higher final intelligence (Mean IQ 100)
→ (4) Least fast intellectual development among East Asians and highest final intelligence (mean IQ 105)
Africans are ahead of Europeans in intellectual and motor development until around 30 months (2.5 years).
Table 14.2. Differences between the means of South African Black and American White Infants on the Bay Scales of Infant Development, expressed as ds
| AGE (months): | 6 | 12 | 21 | 30 |
| Mental Development: | 0,47 | 0,64 | 0 | -0,01 |
| Motor Development: | 0,94 | 0,24 | 0,06 | -0,01 |
→ Australian aborigines also have a low IQ (62) and similarly show early infant maturity. They are more advanced than Caucasians in controlling the neck, back, and legs (Freedman, 1974).
→ Slower intellectual development among East Asians and higher final intelligence
European children are ahead of East Asian children (for intellectual and motor development) until about 8 years old.
Table 14.4. Norms for Taiwan for the Bayley Scales of Infant Development
| AGE (months): | 6 | 12 | 18 | 24 |
| Mental Development: | -0.88 | -0.82 | -0.48 | -0.23 |
| Motor Development: | -1.06 | -0.97 | -0.74 | -0.27 |
Table 14.3. Norms for Japan for the McCarthy Scales of Children’s Abilities
| AGE (Years) | 2 | 3 | 4 | 5 | 6-8 | Adults |
|---|---|---|---|---|---|---|
| I.Q | 94.4 | 96.7 | 97.1 | 97.9 | 99.1 | 105 |
It’s a well-known principle of evolutionary biology that infants of more developed species have a longer childhood in which they depend on their mothers. As soon as baby reptiles hatch from their eggs, they can move and fend for themselves, while monkeys have a few years of maternal dependence. Among the primates, the most primitive are the lemurs, who have 2 years of maternal dependence; macaques are a little more developed and have 4 years of care by the mother; chimpanzees are even more developed and require about 8 years of maternal dependence; and humans are the most developed and have about 14 years of maternal dependence (Lovejoy, 1981, Rushton, 2000, p.205).
J.P.Rushton shown that this principle extends to the three main races of homo sapiens: East Asians have a slower development, a longer period of dependence, and the highest final intelligence; Caucasians (Europeans, South Asians, and North Africans collectively) mature faster, while Sub-Saharan Africans grow fastest, have the shortest period of maternal dependency, and the lowest final intelligence. These differences are present in physical, motor, and mental development. Regarding physical development, Africans typically exhibit greater skeletal maturity at birth, faster dental development in childhood, and faster sexual development, with earlier adolescence (measured by breast development in girls and genital development in boys). Rushton’s theory was confirmed by the Japanese anthropologist Kunihiko Kimura (Eiben, 1998).
These differences in the speed of intellectual maturation point again to the genetic causality of racial differences in intelligence, which are part of an evolutionary pattern.
21. Existence of Race Differences in Intelligence for 10.000 Years
Contemporary I.Q. differences between races and between nations can be identified 10 thousand years ago from differences in terms of:
-cranial capacity
-in the ability to make the Neolithic transition from hunting and gathering to sedentary agriculture 8000 years ago
-in the development of early civilizations 6000 years ago
-in scientific, mathematical, and technological advances of the last 2500 years
Consistency of Race Differences in Intelligence over Millennia, Richard Lynn, Personality and Individual Differences 48 (2010) 100–101.
22. Race Differences in the Frequencies of Genes Linked to Intelligence
• Intelligence is highly genetic and polygenic. It implies it’s dictated by certain genes that have a higher frequency in smarter races than in less intelligent ones4.3.
• Lots of genes (thousands) have already been linked to intellectual gain, and they show a racial frequency parallel to racial I.Q.
The gene of congenital myopia17
The gene of congenital myopia: gain of 7 IQ points (homozygous recessive)
-Highest frequency among Ashkenazi (mean IQ 110)
-Second highest frequency among East Asians (mean IQ 105)
-Third highest frequency among Europeans (mean IQ 100)
-Less frequent among South Asian / North African (Middle Eastern, average IQ 84)
-The least frequent among Africans (average IQ 71)
CHRM219 gene
Location: 7q31-35.
• Gain of 6.89 IQ points in individuals carrying the rs2061174 A allele in the adult population.
The allele appears in 45% of Africans, 80% of Europeans, and 100% of East-Asians, following the hierarchy of IQ
Dysbindin-1 gene (DTNBP1) 19
• There are 6 different alleles of this gene. Frequency differences between races would explain a third of the intellectual differences between blacks and Europeans.
• An allele of this gene would show a particularly strong correlation with IQ
It is present in 93 percent of East Asians (Chinese and Japanese), 82 percent of Europeans, and 63 percent of Africans, which follows the hierarchy of IQ
Polygenic Score (GWAS)
A recent study20 published in the journal Intelligence looked at all the genetic variations increasing intelligence discovered to date, highlighted by GWAS (Genome-Wide Association Study, allowing the illumination of many different genetic variants involved in a phenotypic trait).
The study then evaluated racial differences in the frequency of these alleles, and showed that they were parallel to IQ differences between populations; In other words, higher IQ races/populations actually have a higher frequency of alleles increasing intelligence in their genetic background (table below).
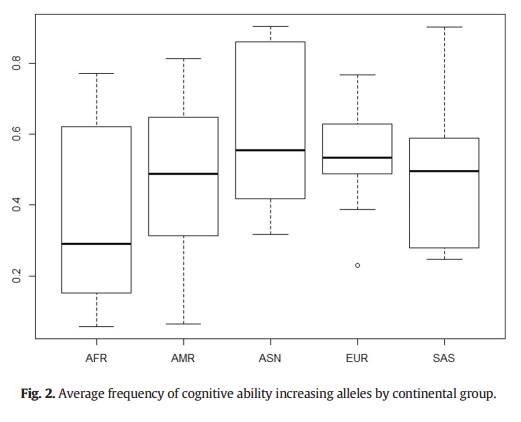
AFR is for Africans, AMR is for Native Americans, ASN is for East Asians, EUR is for Europeans, and SAS is for South Asians and North Africans.
Considering all the genetic variants that increase intelligence highlighted so far, these alleles are more common among East Asians (average IQ 105), followed by Europeans (average IQ of 100). Amerindians (AMR, middle Q.I of 86) and South and North African Asians (SAS, middle Q.I of 84) have a lower frequency, and sub-Saharan Africans have the lowest frequency of these alleles.
The frequency of these genetic variants increasing intelligence is in agreement with the average intelligence of the populations.
The study also estimates the frequencies of these alleles more precisely for different countries and shows a close link between national IQ and the frequency of these alleles in the population.
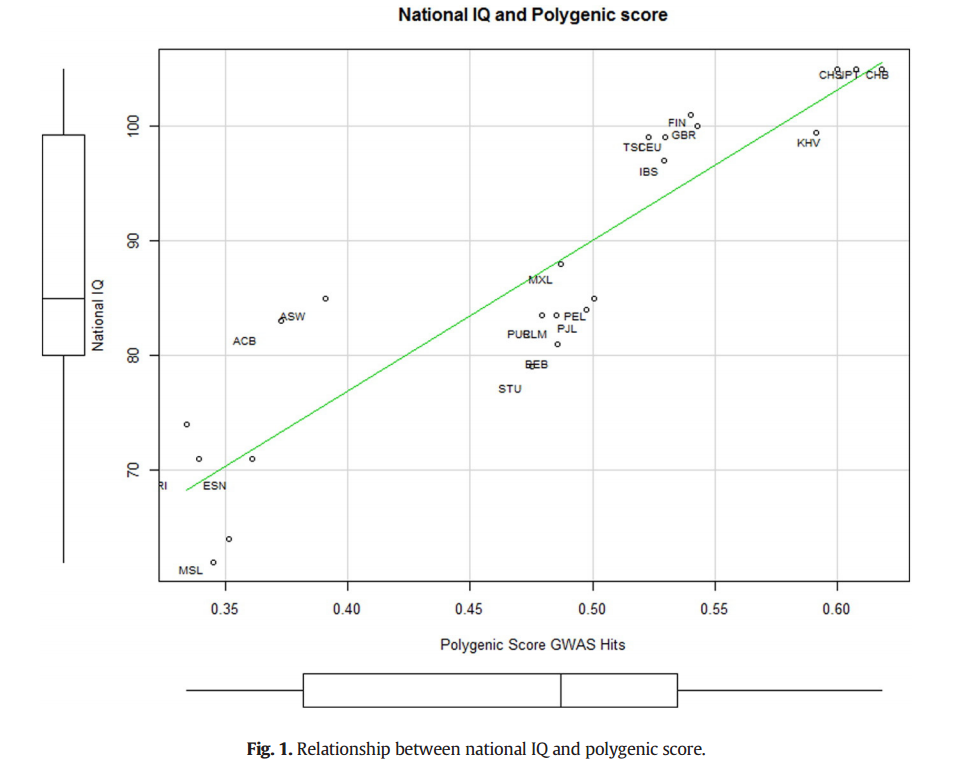
Fig. 2 and Fig. 1 from “A review of intelligence GWAS hits: Their relationship to country IQ and the issue of spatial autocorrelation” Intelligence 53 (2015) 43–50.
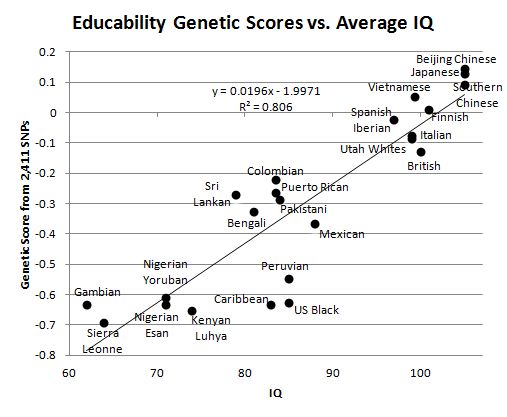
Below is a graph of educability genetic scores based on over 2400 allelic variations. These scores are highly correlated with intelligence; they are even currently better estimators of intelligence than purely intellectual scores, because studies have been conducted on larger samples (Plomin, 2018).
As can be seen, these educability genetic scores are parallel to racial IQs.
East Asians have the highest frequencies of favorable alleles, followed by Europeans. Africans have the lowest frequencies of these alleles.
In 2019, Kirkegaard, Dunkel, and al. show that Ashkenazi Jews have a higher PGS score for intelligence.
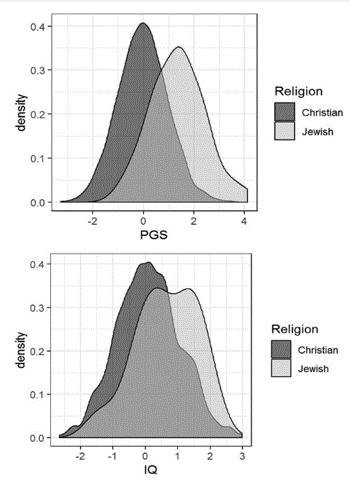
Dunkel, Kirkegaard et al. (2019) “Polygenic scores mediate the Jewish phenotypic advantage in educational attainment and cognitive ability compared with Catholics and Lutherans” Evolutionary Behavioral Sciences.
This 2019 study corroborates Piffer D.’s 2018 results, which already showed the highest PGS score for intelligence among Ashkenazi Jews.
Piffer D. (2018) Evidence for recent polygenic selection on educational attainment and intelligence inferred from GWAS hits: a replication of previous findings using recent data.
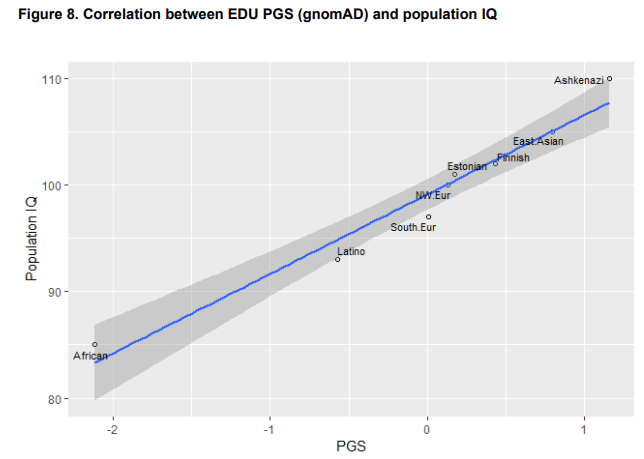
It is again clearly noticeable that the mean population’s IQ is reflected in the polygenic score. Populations with higher IQs have a higher allelic frequency linked to higher intelligence.
Conclusion
“Genome-wide association studies establish that human intelligence is highly heritable and polygenic.18”
— Nature, 2011.
“Intelligence — the ability to learn, reason, and solve problems — is at the forefront of behavioural genetic research. Intelligence is highly heritable and predicts important educational,
occupational and health outcomes better than any other trait.“
— Nature, 2018.
References for the Entire Page
1. Plomin, R., DeFries, J. C., McClearn, G. E., & Rutter, M. (1997). Behavioral Genetics.
2. This table is inspired by a similar one in Eysenck, H. J. (1971). The IQ Argument: Race, Intelligence, and Education.
3. Lynn, R. (2006). Race Differences in Intelligence: An Evolutionary Analysis, Chapter 4, pp. 29–73. Washington Summit Publishers.
4. High racial IQ stability across time and space is a consequence of high heritability. Data can be found:
4.1 -Lynn, R. (2011). The Global Bell Curve: Race, IQ, and Inequality Worldwide. Washington Summit Publishers.
4.2 -Rushton, J. P. (2010). The Heritability of World IQ Differences. Published by American Renaissance.
4.3 -Lynn, R. (2006). Race Differences in Intelligence: An Evolutionary Analysis, Chapter 4, pp. 29–73. Washington Summit Publishers.
Several studies have been conducted to compare brain size. For a summary, see Race Differences in Intelligence: An Evolutionary Analysis. A similar table can also be found in Le Quotient Intellectuel: Ses Déterminants et son Avenir by Prof. Serge Larivée, Montréal, 2009.
6. Graph from Jensen, A. R. (1998). The g Factor.
7,8,9,10 et 11. Race differences in intelligence. An Evolutionary Analysis Richard Lynn, Washington Summit Publisher, 2006. 7. pp.64; 8. pp.161; 9. pp.119; 10. pp.141; 11. pp.105
12. Lynn, R. (2001). The Science of Human Diversity. University Press of America.
13. Baker, J. R. (1974). Race. Oxford University Press.
14. Rushton, J. P. (2000). Race, Evolution, and Behavior. Charles Darwin Research Institute.
15. Rushton, J. P., & Rushton, E. W. (2004). Progressive changes in brain size and musculoskeletal traits in seven hominoid populations. Human Evolution, 19, 173–196.
16. Sonke, C. J. (2000). Cross-Cultural Differences in Simple Cognitive Tasks: A Psychophysiological Investigation. Tilburg University Press.
17. Karlsson, J. L. (2009). Major Intelligence Gene Tied to Myopia: A Review. Mankind Quarterly, 49(3–4).
18. Davies, G., Tenesa, A., Payton, A., Yang, J., Harris, S. E., et al. (2011). Genome-wide association studies establish that human intelligence is highly heritable and polygenic. Molecular Psychiatry, 16, 996–1005.
19. Roth, B. M. (2010). The Perils of Diversity: Immigration and Human Nature. Washington Summit Publishers.
20. Piffer D. (2015) A review of intelligence GWAS hits: Their relationship to country IQ and the issue of spatial autocorrelation. Intelligence 53, 43–50.
21. Plomin, R., & von Stumm, S. (2018). The new genetics of intelligence Nature Genetics, 2018.
22. Altmann, A. et al. (2018). Evidence for bias of genetic ancestry in resting-state functional MRI. bioRxiv.
23. Fan, C. C. et al. (2015). Modeling the 3D geometry of the cortical surface with genetic ancestry. Current Biology, 25, 1–5.
ferences in brain site (cc) and intelligence